Connect a Cloud Account, See Dollar Findings in Five Minutes
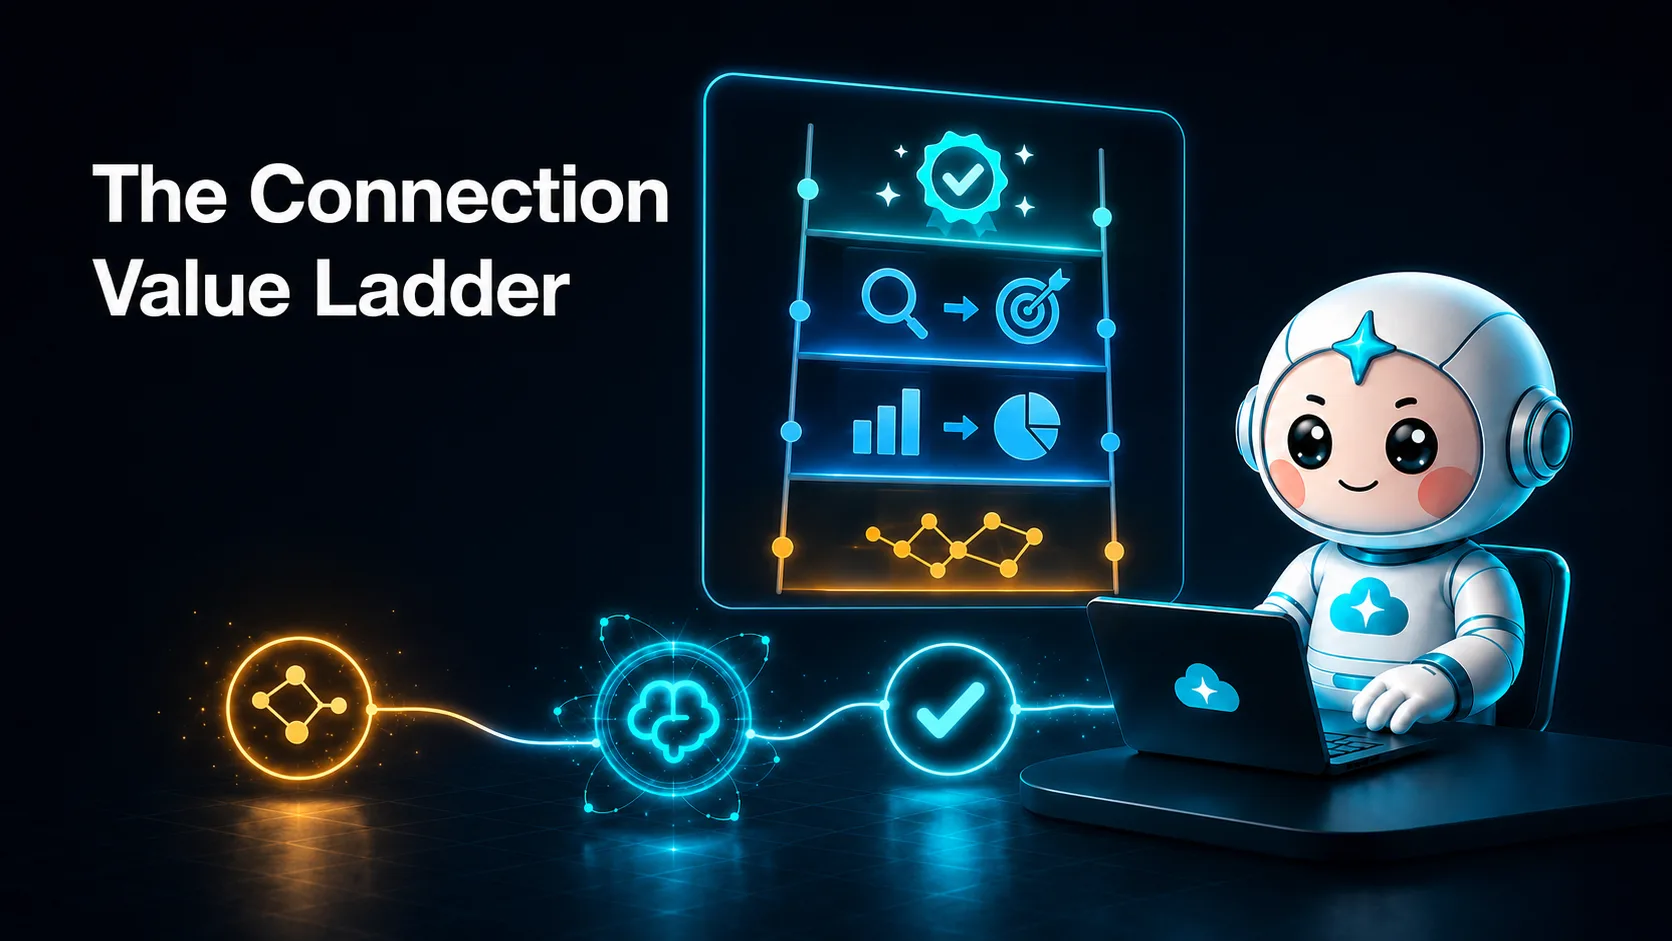
This is part two of our Connection Value series. Part one laid out the ladder: what a connection should return in the first five minutes, the first week, and every month after. This article walks that ladder for the connection most teams make first: a cloud account, whether that's AWS, Azure or GCP.
The claim in the title is specific on purpose. Not "insights." Not "visibility." Findings with dollar estimates attached, before you type a single prompt. If a tool asks for access to your cloud account, the least it owes you is quick proof that the access was worth granting. Here's what that looks like in practice and, just as important, what a read-only connection can and can't do.
01Minute 5
First findings
Idle, unattached and oversized resources with dollar estimates.
02Minute 10
Topology map
Compute, storage, network and databases, each with its cost.
03Day 7
Weekly report
Deltas, new findings and savings actually realized.
04Week 2
Baselines
Anomalies arrive with a probable cause attached.
05Monthly
Coverage
Commitment analysis with break-even math, for you to approve.
Why waste sits in plain sight
Every account has unattached volumes, idle instances and forgotten IPs. None of it is hidden. It persists for structural reasons:
- Nobody's job is to look. The engineer who launched the instance moved on to the next ticket. The finance team sees one line per service on the invoice, not one per resource.
- The bill arrives a month late. By the time a cost shows up on the invoice, the deploy that orphaned the volume is three weeks old and nobody remembers it.
- Native consoles answer one question at a time. The commands below are each correct and each cheap. Running all of them, across every region and every account, every week, is the part that doesn't happen.
- Deletion feels risky without evidence. "Is this volume safe to delete?" needs a last-attached date, a snapshot check and an owner. Without those, the safe choice is to leave it, forever.
Here's what the manual sweep looks like on AWS, one region at a time:
# Unattached EBS volumes
aws ec2 describe-volumes --filters Name=status,Values=available \
  --query 'Volumes[].[VolumeId,Size,CreateTime]' --output table

# Elastic IPs associated with nothing
aws ec2 describe-addresses \
  --query 'Addresses[?AssociationId==null].[PublicIp,AllocationId]' --output table
On Azure and GCP:
# Azure: managed disks not attached to any VM
az disk list --query "[?diskState=='Unattached'].[name,diskSizeGb,resourceGroup]" -o table

# GCP: persistent disks with no users
gcloud compute disks list --filter="-users:*" --format="table(name,sizeGb,zone)"
Then multiply by regions, accounts and subscriptions, add utilization data for the idle-instance check, and price each result. That's the part a connection should do for you.
Minute zero to five: read-only role, first findings
You don't hand over credentials. You create a read-only identity in your own cloud from a provided template:
- AWS: a cross-account IAM role with a read-only policy. Paste the role ARN.
- Azure: an app registration with Reader on the subscription(s) you choose.
- GCP: a service account with viewer-level roles on the project(s) you choose.
01Your clouds
Read-only identity
 AWSCross-account IAM role
 AzureApp registration with Reader
 Google CloudService account with viewer roles
Created from a template you can review
02Analysis
 CloudThinker
- ScanWaste with $/month estimates
- MapTopology with cost per node
- BaselineSpend and utilization norms
- ExplainAnomaly to probable cause
No write access at connection time
03Where the team works
Reports and approvals
 SlackWeekly report and anomalies
- EmailThe same report, for finance
- Approval screenOne click from any finding
Acting is a separate decision
In each case the template shows the exact permissions, so your security review can see precisely what is and isn't granted before anything connects. No agents installed on instances, no write access at connection time. The connection guide has the full walkthrough for all three clouds; the setup itself is a few minutes of copy-paste.
The moment the connection validates, the first scan starts. It goes after the cheap-to-find, expensive-to-ignore waste first: unattached volumes and disks, idle instances, unused elastic and public IPs, and the most obvious rightsizing candidates. Within about five minutes you have your first three to five findings, each with a monthly estimate.
Numbers below are illustrative: a composite first scan on a mid-market account around $45K/month. Your account will differ.
| Resource | Finding | Est. $/month |
|---|---|---|
| 17 EBS volumes / managed disks | Unattached, oldest 11 months, total 2.8 TB | ~$290 |
| 9 compute instances | Under 8% avg CPU over 30 days | ~$1,900 |
| 8 elastic / public IPs | Allocated, associated with nothing | ~$70 |
| 2 database instances | Sized 2xlarge, sustained CPU under 10% | ~$860 |
| 1 non-prod fleet | Staging running 24/7, zero traffic after 8pm | ~$2,400 |
That's roughly $5,500/month surfaced in the first five minutes. It isn't the deep architectural work, just the waste sitting in plain sight once something actually looks. Each finding carries its evidence: the metrics window, the current cost, and the projected saving as a range, not a single suspiciously confident number.
If you're on AWS and want the full seven-category treatment (snapshots, Savings Plans coverage, NAT gateway traffic and the rest), we've written a dedicated AWS deep-dive. This article stays at the level that applies equally to all three clouds.
Minute ten: a map of what you actually run
While the cost scan runs, the same read access builds an inventory: compute, storage, network and databases, laid out as a topology map rather than a flat list. Each node carries a cost annotation, so "what's in this VPC?" and "what does this VPC cost?" become the same glance.
This sounds like a nicety until the first time you use it. Most teams find at least one thing on the map they didn't know was running: a load balancer from a decommissioned service, a database replica in a region nobody remembers choosing. The map is also what later findings hang off. When an anomaly fires in week two, it points at a node you've already seen, not an opaque resource ID.
Alongside cost, the same read-only access is enough for a security posture preview: publicly readable storage buckets, security groups open to 0.0.0.0/0, IAM access keys past 90 days without rotation. It's a preview, not an audit, but it's the kind of list that tends to get forwarded to the security channel within the hour.
Day seven: the first weekly report
A week in, the first scheduled cost report lands in Slack or email. It's built to be read in ninety seconds:
- Deltas: what spend did week-over-week, by service, with the movers called out.
- New findings: waste that appeared since last week. Every deploy can orphan a volume, and a weekly cadence catches it while the responsible engineer still remembers the deploy.
- Savings realized: not projected, but what was actually saved by findings you acted on, so the report earns its place in the channel.
- One "act on this" deep link: the single highest-value open finding, one click from the report to the approval screen.
The realized-savings line matters more than it looks. Plenty of tools can produce a big projected number on day one. The number that keeps a report from being muted is the one that goes up because of things your team actually did.
Week two onward: one anomaly, end to end
After a week of data, CloudThinker has baselines on spend and utilization per service and per environment, adjusted for your weekly rhythm so a normal Monday ramp doesn't page anyone. From then on, anomalies come with a probable-cause line instead of a bare red number: "Compute spend in us-east-1 up 34% since Tuesday 14:00, coincides with the autoscaling group's new minimum of 6."
Here's how a line like that gets written. A 34% jump in compute has a few readings, and each one predicts different evidence:
- Traffic growth. Load went up and autoscaling followed. Request metrics rise first, and instance count tracks them.
- A capacity change. Someone changed the group's settings. Instance count steps up at one moment while traffic stays flat.
- New resources. Something was launched outside the existing groups. The group is unchanged, but new instance IDs appear.
The checks are ordinary read-only calls. The group's current settings:
aws autoscaling describe-auto-scaling-groups \
  --auto-scaling-group-names web-asg \
  --query 'AutoScalingGroups[].[MinSize,DesiredCapacity,MaxSize]'
And who changed them, from CloudTrail:
aws cloudtrail lookup-events \
  --lookup-attributes AttributeKey=EventName,AttributeValue=UpdateAutoScalingGroup \
  --start-time 2026-10-06T00:00:00Z
Flat request metrics, a step in instance count at 14:00, and an UpdateAutoScalingGroup event at 13:58 setting the minimum to 6: that rules out growth and new resources, and it's the probable cause the finding names, with links to each piece of evidence.
If you've also connected a repository, anomalies get correlated with deploy markers, which is often the whole diagnosis: the spend jump started eleven minutes after a specific merge. That's part three of this series, and a first taste of why connections compound rather than just pile up.
Monthly: commitment coverage, your call
The biggest line items on most cloud bills aren't waste. They're full-price payments for stable workloads that should be covered by reserved instances, savings plans or committed-use discounts. Each month, CloudThinker analyzes your coverage: what your stable baseline supports, where you're over- or under-committed, and what a specific purchase would save, with the break-even math shown.
These arrive as recommendations you approve, not actions that happen. Commitment purchases are multi-thousand-dollar, multi-year decisions, so for nearly every team a named person clicks approve after reading the analysis. CloudThinker prepares the case; the decision stays yours.
Why this beats the traditional approach
| Monthly bill review | Manual CLI sweeps | Read-only CloudThinker connection | |
|---|---|---|---|
| When waste is found | A month after it starts | Whenever someone has time | Minutes after connecting, then weekly |
| Coverage | Totals per service | One region, one account at a time | Every connected account and region |
| Dollar impact | On the invoice, after the fact | Calculated by hand | Estimated per finding, as a range |
| Anomaly cause | Guessed in a meeting | Traced if someone digs | Probable cause with evidence |
| Commitments | Spreadsheet modeling | Spreadsheet modeling | Coverage and break-even, monthly |
| Access needed | Billing console | Your own credentials | A read-only role you can review |
The deeper difference is cadence. Waste is created continuously, by every deploy and every experiment, but the traditional ways of finding it run monthly or whenever someone has a free afternoon. A connection that looks every day closes that gap without anyone having to remember to look.
What read-only access won't do
Worth stating plainly, because "connect your cloud account" should make you ask exactly this.
Everything above (the findings table, the topology map, the security preview, the weekly report, the anomaly baselines, the coverage analysis) runs on read-only access. During all of it:
- No resource is modified. Not resized, not stopped, not rescheduled.
- Nothing is deleted. Not even a 14-month-old unattached volume the evidence says is safe.
- No commitment is purchased. Coverage analysis produces a recommendation and a break-even case, never a transaction.
Acting on findings takes two separate, deliberate steps: granting scoped write permissions (a second template, as reviewable as the first), and then letting CloudThinker act within Auto Mode, so you decide what runs on its own and what waits for approval. Everything is in a full audit trail: what was found, what was proposed, who approved and what changed.
The honest framing: read-only access buys you a continuously refreshed audit with dollar figures attached. It doesn't give the agent the keys to anything. Those are granted separately, narrowly and on your schedule, or never, if a findings feed is all you want.
Getting started
Connect one account with the read-only template, then ask:
"Show me the five largest waste findings in this account with monthly cost estimates and the evidence for each. Propose only, change nothing."
"What did we spend on compute in us-east-1 this week compared to last, and what explains the difference?"
"How much of our stable compute baseline is covered by Savings Plans or reservations, and what would a one-year commitment save?"
Related reading
- Part one: the connection value ladder
- Part three: connect a repo, get a first PR review
- Automating AWS cost optimization with an AI agent
- Auto Mode: you decide what runs on its own
Five minutes is the test
Don't evaluate a cloud connection on its feature list. Evaluate it on what it hands you in the first five minutes with nothing but a read-only role. A findings table with real dollar estimates is a fair opening bid; everything after (the map, the weekly report, the baselines, the coverage analysis) is the same access paying rent every week.
Try CloudThinker free (100 premium credits, no card required) and follow the connection guide for AWS, Azure or GCP. Your own first findings table should exist before your coffee gets cold.