2:47 A.M. in Someone Else's Production: Inside CloudThinker's On-call AgenticOps Team
This is what one page looked like on a recent night shift:
02:47  [P1] payments-api: 5xx rate 0.4% -> 18%, p99 climbing
02:48  Resolve acknowledges. Correlating: API errors vs DB connection wait time
02:51  Investigation posted: connection pool ceiling lowered in yesterday's
       deploy; saturation began at the overnight traffic uptick.
02:53  Proposed fix: restore pool ceiling + rolling restart. Sent for approval.
02:57  Human on-call (CloudThinker SRE) reviews on her phone. Approves.
02:58  Fix applied inside a sandboxed session. Watching.
03:04  5xx back to 0.4%. p99 recovered. Validation: green.
03:06  Jira ticket resolved. Report attached. Customer still asleep.
Nine minutes of human attention, spent on a phone, in bed. One approval. No laptop, no war room, no "can someone share the dashboard link?" The customer's engineers read the story over coffee.
Here's what that approval moment looks like. The investigation arrives as a briefing, not an alarm:
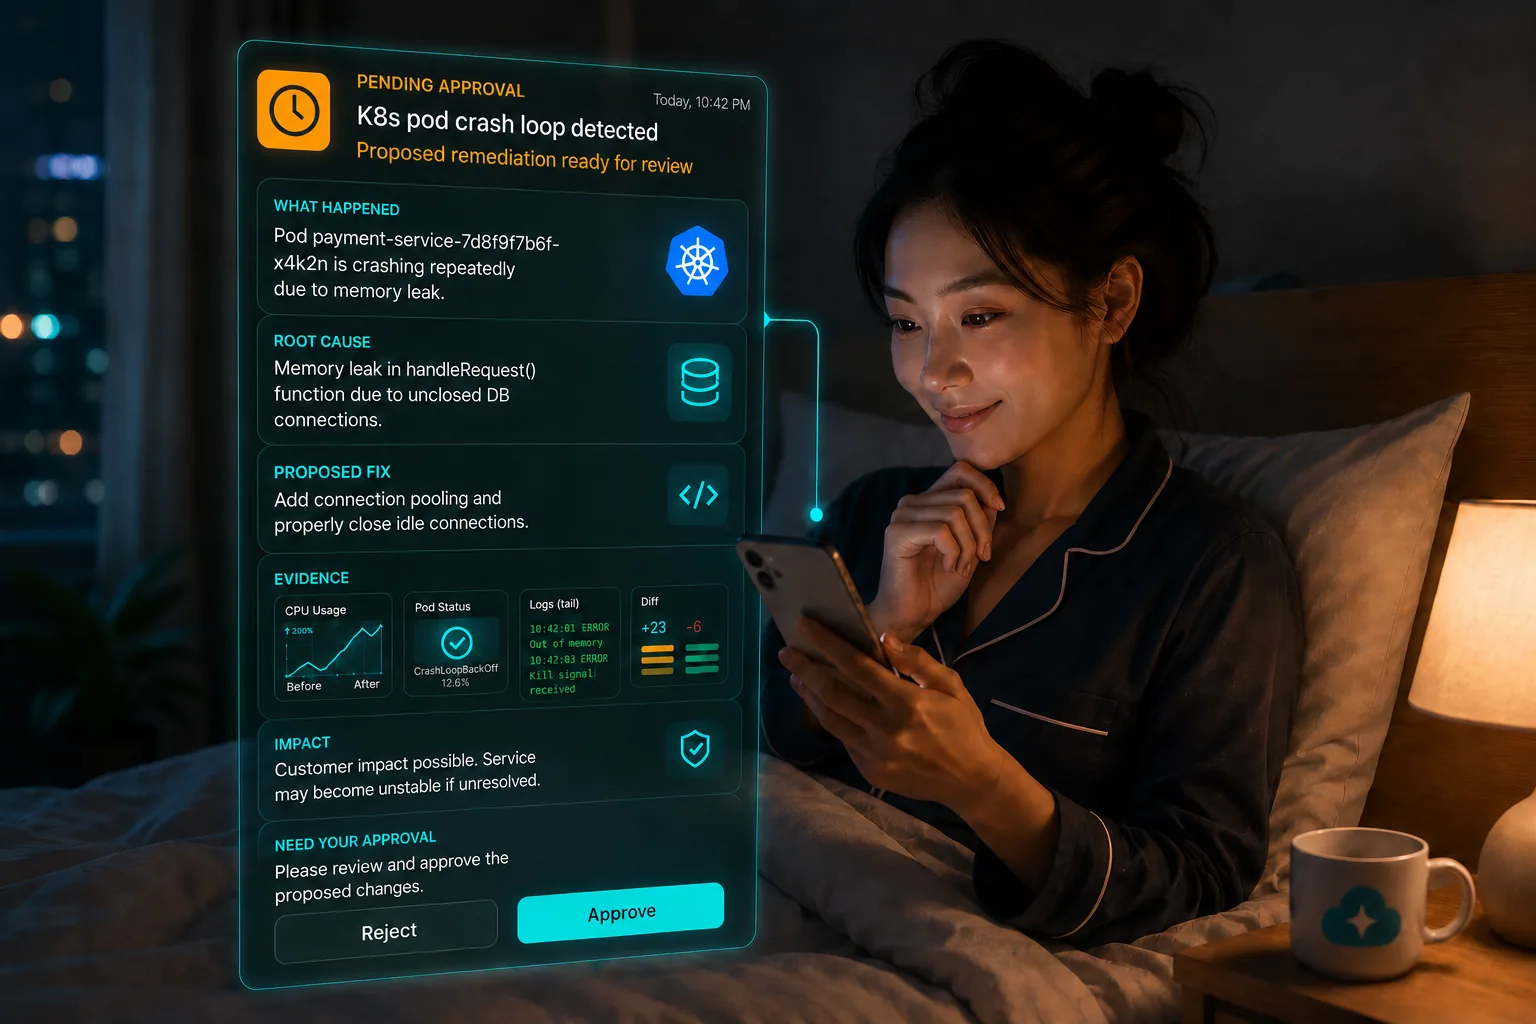
Everything she needs to say yes or no is on one card: what happened, the root cause, the proposed fix, the evidence behind it and the blast radius. The two buttons at the bottom are the whole human interface at 2 a.m., and nothing touches production until one of them is pressed.
CloudThinker runs on-call for customers every night, with a team that's part human, part agentic. We call it AgenticOps. This post covers how that team works: the humans, the loop, the nights the AI is wrong, and the actions it will never be allowed to take. Read those last two sections even if you skip the rest. That's where the trust lives.
Why the classic on-call shift burns people out
If you've carried a pager, you know the other version of the 02:47 incident because you've lived it. The alert with no context. Five dashboards. The deploy nobody mentioned in the channel. Forty minutes to build the picture that a four-minute fix needed. The postmortem you still owe from the last one.
None of that is about lazy engineers or slow tools. It comes from how on-call is built:
The alert carries a symptom, not a case. A threshold fires on one service. It doesn't know about yesterday's deploy, the sibling alerts firing in the same minute, or that the database behind it is the real story. The person paged has to assemble that context by hand, at the worst hour of the day.
Context lives in heads. Which deploy lowered the pool size, which pipeline ships CDN config, which customer has a launch this week. When the engineer who knows is asleep or on leave, the shift diagnoses by folklore.
Runbooks are static. A runbook says what to do when you already know what's wrong. Most of the night is spent working out what's wrong.
Nothing confirms the fix held. The graphs recover, everyone goes back to bed, and the same symptom returns at the next traffic peak as a brand new page with no history attached.
Every night starts from zero. The fix from last month sits in a Slack thread. The next on-call re-derives it.
The answer we landed on isn't "remove the human". It's to move the human from assembling context to judging it.
The pitch we refuse to make
Here's the pitch you won't hear from us: "AI answers your pager. No humans needed."
We operate production systems every day and we don't believe it. The agents aren't weak; production is simply where trust is either real or it isn't. So CloudThinker's rotation is staffed by an Operation Team of humans: SREs, security engineers and DevOps engineers. They aren't a fallback layer bolted on for the sales deck. They own every shift, and their names are on every approval.
What the platform changes is what those humans spend the shift doing:
- Before: watching dashboards, triaging duplicate alerts, grepping logs at 3 a.m., writing the postmortem at 9.
- Now: reviewing investigations that arrive with evidence attached, approving or rejecting proposed fixes, and taking the novel failures that deserve a senior engineer's full attention.
The agents carry the toil. The humans carry the judgment. The architecture makes that split structural rather than a promise.
How the team is wired
01Managed surfaces
Your stack
 Cloud and infrastructureAccounts, clusters, hosts, networks
 ObservabilityMetrics, logs, traces, alerts
- SIEMSecurity findings and audit trails
- ITSMTickets and change records
Scoped credentials, nothing installed
02Agentic engine
 CloudThinker
- DetectSignals clustered into one case
- ResolveFix proposed, a human approves
- ValidateSame telemetry, re-checked
- RememberResolved cases become runbooks
Operation Team above every step
03Service delivery
Customer SLAs
- UptimeSLA monitoring from measured data
- EscalationA briefed human engineer on the line
- Request ticketsTicket SLAs in the customer Jira
Three measurable promises
Reading it left to right:
- Managed surfaces. The platform connects to the customer's cloud and infrastructure, observability stack, SIEM and ITSM tools through CloudThinker Connections: scoped credentials, nothing installed inside the customer's environment (how connections work).
- The agentic engine. A closed loop (detect, resolve, validate) running continuously against those surfaces. The order of its steps matters, and the next section explains why.
- The platform. The engine orchestrates the CloudThinker AgenticOps Platform: on-call AI, investigation, operations, reporting, cost and security capabilities.
- SLA and service delivery. Everything flows out as three measurable promises: uptime SLA monitoring, on-call escalation, and ticket SLAs in the customer's own Jira.
- Human oversight, across all of it. The Operation Team sits above the whole system, not beside it and not after it.
The loop: detect, resolve, validate
01Signal
Detect
Related alerts, findings and tickets cluster into one case and investigation starts.
02Human gate
Resolve
A fix arrives with evidence. Anything that changes production waits for a named engineer.
03Proof
Validate
The telemetry that raised the alarm is re-checked. A failed check reopens the case.
04Memory
Learn
The case, the reasoning and the outcome become a runbook for the next match.
Every run through the engine takes the same steps, in the same order, with the human gate in the middle.
1. Detect. Signals stream in from the managed surfaces: an alert, a SIEM finding, a threshold breach, a customer ticket. Resolve clusters related signals into one case instead of a page storm, and the investigation opens immediately. Evidence gathering starts before any human is interrupted.
2. Resolve, with human approval. The investigation works hypothesis first. Take the 02:47 page. There were three readings: the deploy broke something in code, the database itself degraded, or the traffic outgrew a limit. Each predicts different data. A code bug shows errors from the first request after the deploy. A sick database shows high query latency for every client, not only this one. A limit shows errors that start only when load crosses a line. The engine pulled the pool metrics, the deploy diff and the traffic curve, and the third reading held: the deploy cut the pool ceiling, and errors began exactly when overnight traffic rose past it.
The proposed fix (restore the ceiling, rolling restart) went to a human with that evidence attached. Anything that changes production waits for someone on the Operation Team. We don't apologize for that limit; it's the reason a customer can hand us their pager at all.
3. Validate. The loop doesn't close on hope. The platform re-checks the same telemetry that raised the alarm, confirms the system is healthy, and only then marks the case resolved. If validation fails, the case reopens and escalates to a human.
Then the loop feeds itself. Resolved cases become runbooks with their reasoning and outcome attached, so the next similar incident is detected faster, investigated with prior context, and fixed with a pattern that has already earned trust once.
How a fix earns the right to run alone
The platform reads freely (metrics, logs, events, inventory) and proposes. Writes, from a restart to a scaling change to a ticket, go through Auto Mode, so the customer decides what runs on its own and what waits for an engineer's approval. Novel or high-blast-radius changes keep a human in the loop, and the next section lists the ones that never run alone.
The part where the agent is wrong
Every vendor shows you the 02:47 timeline. Here are two nights we could leave out of this post and won't, because if you run production you already know these nights exist.
The confident wrong answer. An API starts timing out minutes after a redeploy, and the investigation blames the deploy. Plausible, well evidenced, wrong. The human on-call notices what the correlation missed: a CDN configuration change that went out through a different pipeline at almost the same minute. She rejects the proposed rollback, redirects the investigation, and the real fix ships twenty minutes later. The rejected proposal is recorded next to the correct one, and the root-cause model now checks that second pipeline on every similar case.
The fix that didn't hold. A memory remediation passes validation, metrics recover, everyone moves on, until the next traffic peak brings the symptom back. Validation catches the regression, reopens the original case with its full history instead of opening a fresh one, and escalates to a human with a note that the first fix was insufficient. The permanent fix goes through the customer's normal change process the next morning.
That's why the loop is shaped the way it is. Step 2 exists because agents are sometimes confidently wrong. Step 3 exists because "it worked when I left" isn't a resolution. We designed the system around fallibility, which is the same assumption you'd want your own on-call to make about itself.
What the agents are never allowed to do
Some actions never run alone, however much trust a fix pattern has earned:
- Destroy data. No dropping databases, deleting snapshots or emptying buckets. Ever. Deletion proposals are filed as tickets for humans.
- Change identity and access alone. IAM policies, security groups and network exposure changes always need a named human approval.
- Run schema migrations. Proposed, evidenced and handed to the customer's change process, never executed by the platform on its own.
- Cut over traffic. Cross-region failovers and DNS changes are human decisions with an agent-prepared briefing.
- Touch anything the customer marks off-limits. Customer-defined boundaries are enforced, not advisory.
These rules are code, not a policy document. The Guardrails Engine evaluates every action before it executes, execution happens in CloudThinker's Sandbox with scoped credentials and recorded sessions, and the security model is documented down to what each agent can reach. An agent that structurally can't delete your database is a very different proposition from one that promises not to.
One platform behind the on-call
The same loop orchestrates different capabilities depending on what the night brings:
01First response
Oncall SRE AI
Resolve picks up each page in seconds and briefs the on-call with a summary.
02Evidence
Investigation
Logs, metrics, traces and recent changes correlated into a root-cause narrative with links.
03Hands
Agentic Operation
Approved fixes run in the CloudThinker Sandbox, under guardrails, with the session recorded.
04Receipts
Automation Report
What was detected, who approved it, what changed and how recovery was verified.
05Quiet hours
Optimize
Cost anomalies and right-sizing candidates, filed as proposals for the morning handoff.
06Offense
AppSec
Scheduled agentic pentesting whose confirmed findings enter the same loop as incidents.
Each module has its own page if you want the detail: Resolve, how RCA works, autonomous agents, automation tasks, Optimize for cost and CloudThinker AppSec.
The seventh module is easy to skim past: On-call SLA. It tracks the promise itself (response, escalation and resolution times), so the SLA is a measured number in a report, not a line in a contract nobody checks.
Why this beats the traditional on-call rotation
| Traditional on-call | CloudThinker on-call AgenticOps team | |
|---|---|---|
| First look at a page | A person wakes up and starts opening dashboards | The investigation is already posted with evidence |
| Alert storms | One page per symptom | Related signals clustered into one case |
| Diagnosis | From memory and grep | Hypotheses checked against metrics, logs and changes |
| Changing production | Whoever is awake runs commands | Proposed fix, named human approval, sandboxed execution |
| Did it hold | Graphs looked fine when we left | Same telemetry re-checked; failed checks reopen the case |
| Knowledge | In the heads of whoever was on call | Stored as runbooks and reused on the next match |
| SLA | A clause in the contract | Measured and reported every month |
The deeper difference is where human attention goes. A traditional rotation spends its best engineers on assembling context at 3 a.m. This team spends them on judgment: reading a briefing, saying yes or no, and taking the failures nobody has seen before.
What the customer sees
All of that machinery collapses into three promises:
- Uptime. Continuous SLA monitoring of the services we manage, reported from measured data.
- Escalation. A staffed on-call path. When something needs a conversation, a human engineer is on the other end, already briefed by the investigation.
- Request tickets. Work lands in the customer's own Jira with ticket SLAs, visible inside the tools their team already uses.
Every run also produces a receipt: the Automation Report shows what was detected, what was proposed, who approved it, what executed and how recovery was verified. It's the same artifact pattern we use for SOC 2 Type II audits.
Because the platform speaks natural language, raising a request is usually a message in the shared channel:
"The checkout service felt slow around 9 p.m. last night. Can you check whether anything happened and whether we need to scale before the weekend campaign?"
"We leverage CloudThinker to re-organize and standardize our AWS Landing Zone infrastructure, so we can automate 80% of daily operation tasks with CloudThinker."
Tung Nguyen, Infrastructure Leader, F88
A night on shift
Three more moments from a typical rotation:
23:40, an incident. A Kubernetes node group starts evicting pods. Detect, investigate, propose a scaling change with the eviction timeline attached. The on-call SRE approves; the platform executes and validates; the customer's Jira has a resolved ticket before their morning standup.
02:15, a security signal. The SIEM flags an unusual login pattern against a staging bastion. The security engineer on shift gets the correlated picture (source, timing, affected identities) instead of a lone log line. It turns out to be a contractor in another timezone. The case closes with the evidence trail preserved, and the finding feeds the next scheduled AppSec run.
06:50, the handoff. The quiet-hours work surfaces before the shift ends: an Optimize sweep found an oversized database instance and an idle load balancer, both filed as proposals with the evidence attached. The morning shift and the customer start the day with a briefing, not a backlog.
No single tool does all three. A team does, one where agents work every minute of the shift and humans decide the moments that matter.
Getting started
Teams usually meet the on-call AgenticOps team one of two ways:
- Run the platform yourself. Connect your cloud, observability and ITSM through CloudThinker Connections (quickstart), watch every detection and proposal before anything acts, and let individual actions run on their own as the proposals earn it.
- Hand us the pager. The Managed Cloud Service 24/7 is the team described in this post (our Operation Team, our platform, your SLAs) delivered through your existing chat, Jira and on-call tools.
Either way, the first ask can be a sentence:
"Watch production for me tonight. Tell me everything you see and propose fixes, but don't touch anything without my approval yet."
That "yet" is where the relationship starts. A week later, the second ask is usually narrower:
"For staging only, let rolling restarts on confirmed connection-pool saturation run on their own. Everything in production still comes to me."
Related reading
- Introducing Resolve: the Oncall SRE AI behind the loop
- CloudThinker Platform: architecture and primitives
- Auto Mode
- CloudThinker AppSec: agentic pentesting
- Managed Cloud Service 24/7: humans on strategy, CloudThinker on the pager
- CloudThinker documentation
Conclusion
The interesting question about AI in operations was never whether an agent can fix a server. It's what has to be true before an SRE sleeps through the night while it does. Our answer is a team: a loop that detects, resolves and validates; hard limits written as code; receipts for every run; SLAs that are measured; and human engineers who own the judgment calls on every shift.
If you want that team on your pager, start with the Managed Cloud Service 24/7, explore the platform, or book a discovery call.
Steve Tran, CTO, CloudThinker