
The Database Analytics Revolution: From Manual Queries to Intelligent Insights with CloudThinker
Forty-seven. That was the number of pending report requests in the queue on Monday morning.
Elena, the Head of Data at a B2B SaaS company we will call Meridian, stared at the Jira board and felt the familiar weight of an impossible backlog. Each ticket represented someone in the company who needed data to make a decision: the product team wanted feature adoption metrics, the sales team needed pipeline conversion analysis, the customer success team was asking for health scores segmented by plan tier, and finance wanted a cohort retention breakdown for the board deck.
Average turnaround time for a report request: three weeks. Not because the queries were complex, though some were. But because Elena's team of two analysts was the bottleneck through which every data question in the company had to pass. They wrote the SQL, validated the results, built the visualizations, and explained the caveats. Forty-seven requests, two analysts, three-week turnaround. The math was brutal.
Then the CEO's request arrived.
The Request That Broke the Queue
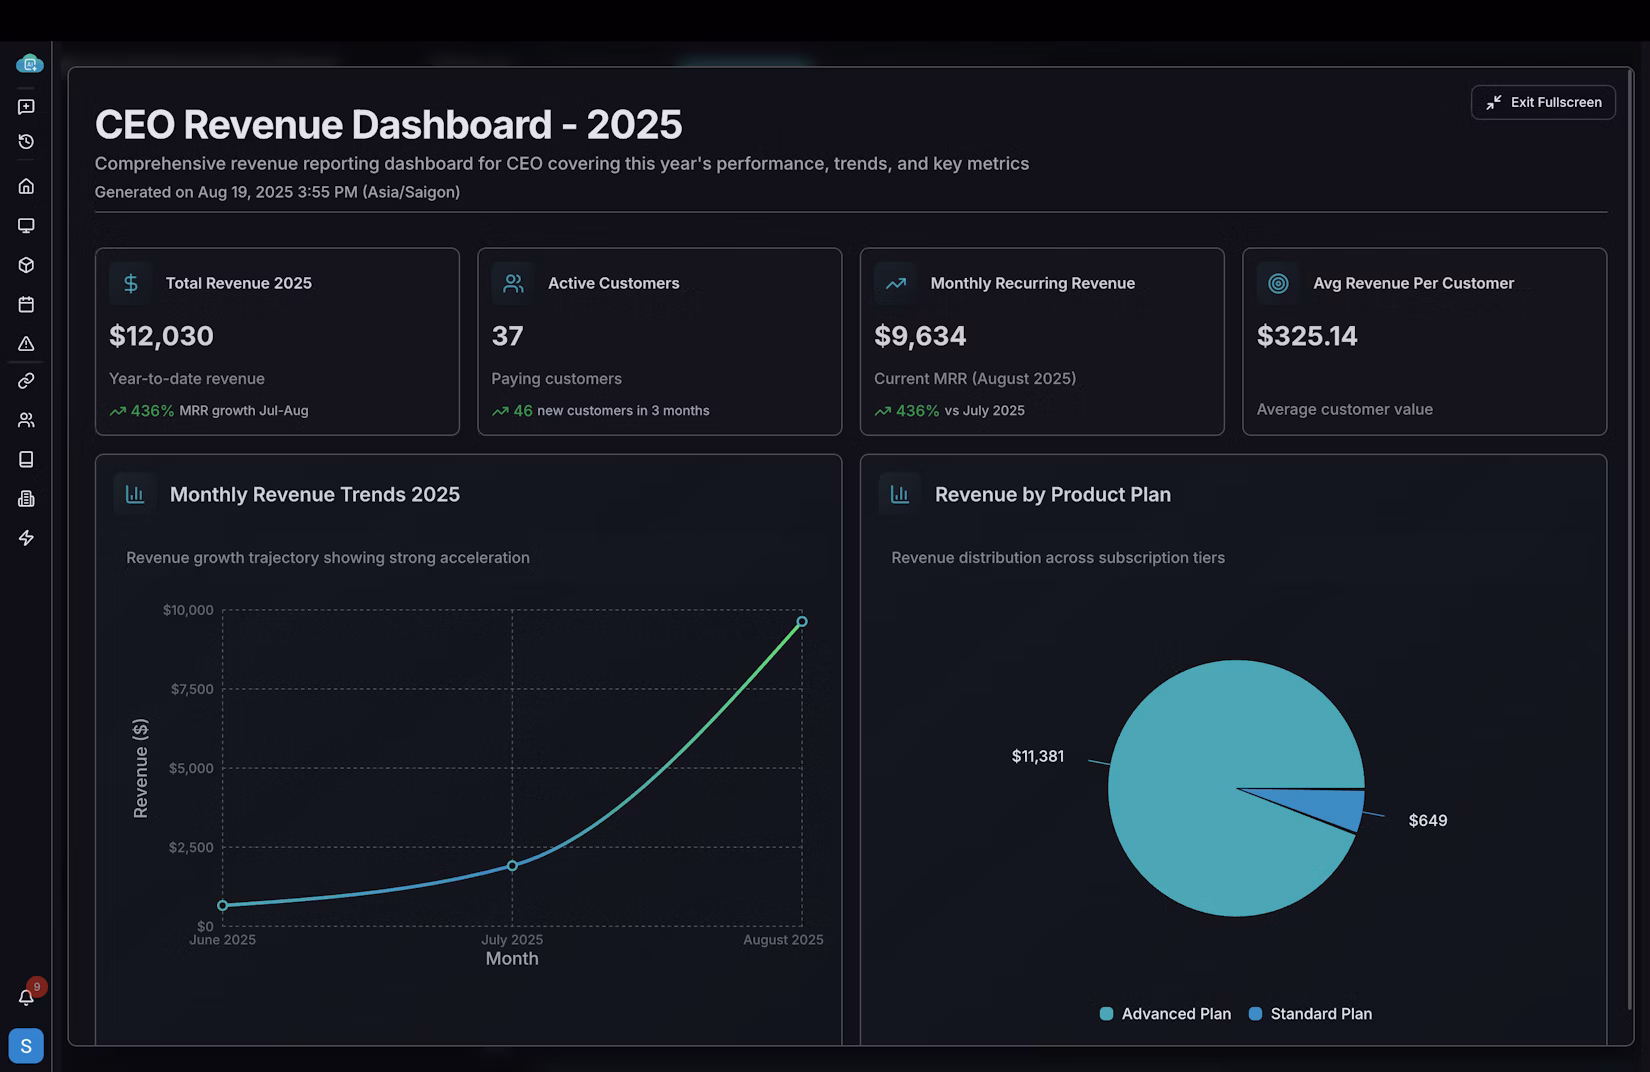
It came via Slack, flagged as urgent: "I need a churn analysis by customer segment, correlated with product usage patterns over the past 12 months. Board meeting is Thursday."
Elena did the mental calculation. The query would need to join customer data from PostgreSQL with product usage events from their analytics warehouse, segment by plan tier, calculate churn rates per cohort, correlate with feature engagement metrics, and produce visualizations suitable for a board presentation. Under normal circumstances, this was a two-day project for a senior analyst.
But both analysts were mid-sprint on the quarterly business review report. Pulling one off that project would delay the QBR, which the CFO had already asked about twice. Not pulling someone off would mean telling the CEO his board prep would not be ready on time.
Elena opened a SQL editor, resigned to another late night, and started writing the first of what she estimated would be seventeen queries.
This is the reality of traditional database analytics: organizations sitting on petabytes of valuable data across PostgreSQL, MySQL, and cloud databases, with 70 percent of it untapped because every insight requires a human analyst to translate a business question into SQL, validate the output, and format it for consumption.
The Evolution of Database Analytics
The progression from manual queries to intelligent analytics follows a familiar arc:
Manual Queries
Basic BI Tools
Advanced Analytics
AI-Driven Analytics
CloudThinker Database Analytics represents the next paradigm shift
Elena's team was stuck between stages two and three. They had good databases, a decent BI tool, and two talented analysts. What they did not have was a way to scale. Adding a third analyst would not solve the problem. It would reduce the backlog temporarily, then the request volume would grow to fill the new capacity. The fundamental issue was not headcount. It was that every data question required a human to act as translator between the business and the database.
Meet Tony: Your AI Database Analytics Engineer
Revolutionary Capability
Continuous Analysis
Real-Time Data Intelligence
Autonomous Visualization
Self-Generating Dashboards
Strategic Insights
Expert-Level Analysis
Tony is CloudThinker's specialized database analytics agent. Unlike a BI tool that requires someone to build dashboards, or a query assistant that helps write SQL, Tony understands the business context behind data questions and translates them into complete analytical workflows.
When Elena connected Tony to Meridian's databases, the first thing it did was map the schema: tables, relationships, data types, and row counts across their PostgreSQL production database and analytics warehouse. Within an hour, Tony had a comprehensive understanding of where the data lived and how it connected.
Then Elena gave it the CEO's request, in plain English: "Analyze customer churn by segment, correlated with product usage patterns, over the past 12 months."
Tony generated the query plan: six SQL queries across two databases, three intermediate transformations, cohort calculations by plan tier and signup month, feature engagement scoring, and a correlation analysis between usage intensity and retention. It executed the queries, validated the results against known totals, flagged two data quality issues (a batch of customers with missing plan tier data and a gap in usage events from a logging outage in March), and produced four visualizations.
Time elapsed: 14 minutes.
Elena spent another 30 minutes reviewing the output, adjusting one chart's axis labels, and adding a narrative summary. The CEO had his board deck by Tuesday afternoon, two days early.
Tony's Comprehensive Database Analytics Expertise
Tony's Dashboard Creation in Action
See how Tony transforms raw database data into actionable business intelligence with automated dashboard creation and intelligent insights.
The Backlog That Disappeared
But the CEO's churn analysis was a single request. The real test was what happened to the other forty-six tickets in the queue.
Over the following two weeks, Elena triaged the backlog into three categories. Routine reports that Tony could handle autonomously with a review step: 28 tickets. Analytical questions that required Tony to generate a first draft for an analyst to refine: 13 tickets. Complex, ambiguous requests that needed human judgment from the start: 6 tickets.
The 28 routine reports were completed in three days. Not by working around the clock, but by Tony processing them in parallel while Elena's analysts focused on the complex work. Feature adoption metrics, pipeline conversions, usage summaries, the steady stream of "can you pull the numbers on X" requests that had consumed 60 percent of the analysts' time.
The 13 analytical questions took another week, but the workflow was fundamentally different. Instead of an analyst spending a full day on each request, Tony produced an initial analysis in minutes. The analyst's role shifted from query writer to quality reviewer, validating Tony's approach, catching edge cases, and adding the business context that only a human with organizational knowledge could provide.
The 6 complex requests remained human-led, as they should. Strategic analysis, ambiguous stakeholder requirements, and novel analytical frameworks that had never been attempted before.
By the end of week three, the backlog was at zero for the first time in Elena's tenure. New requests were being turned around in hours instead of weeks. And her analysts, freed from routine query writing, were doing the kind of deep analytical work they had been hired to do.
The Data Team Meeting That Felt Different
At the monthly team meeting, Elena shared a metric that surprised even her. In the previous quarter, her team had completed 89 report requests. In the first month with Tony, they had completed 67. Not by working harder, but by removing the bottleneck that had been throttling throughput.
"We used to be a query factory," Elena told the team. "Every request came in, an analyst wrote SQL, validated it, visualized it, and moved to the next ticket. We were good at it. But we were a two-person factory with fifty-person demand."
The shift was not just about speed. It was about what became possible when the routine work was automated. One analyst built a self-service analytics layer that let product managers explore feature adoption data without filing a ticket. The other developed a predictive churn model that the customer success team now uses daily. Work that had been on the "someday" list for over a year, completed in the first month because the analysts finally had the bandwidth.
The forty-seven pending requests were not just a number. They were a symptom of a team trapped in reactive mode, translating business questions into SQL instead of driving strategic insight. Tony did not replace Elena's analysts. It gave them back the time to do what analysts actually do: think.
CloudThinker transforms database analytics from manual queries to intelligent insights, delivering actionable business intelligence across PostgreSQL, MySQL, and cloud databases.