CloudThinker Use Case: Global AWS FinOps & Cost Optimization
The Challenge
In multi-region AWS environments, operational costs often spiral out of control due to several common issues:
- Underutilized EC2 instances: Running with average CPU utilization <5%
- Orphaned EBS volumes: Unattached volumes and snapshots older than 90 days
- Idle Elastic IPs: Unassociated IP addresses still incurring charges
- Unoptimized S3 buckets: No Intelligent-Tiering or lifecycle policies implemented
The Result: AWS costs can increase 20–30% monthly without proper visibility and control mechanisms.
The CloudThinker Solution
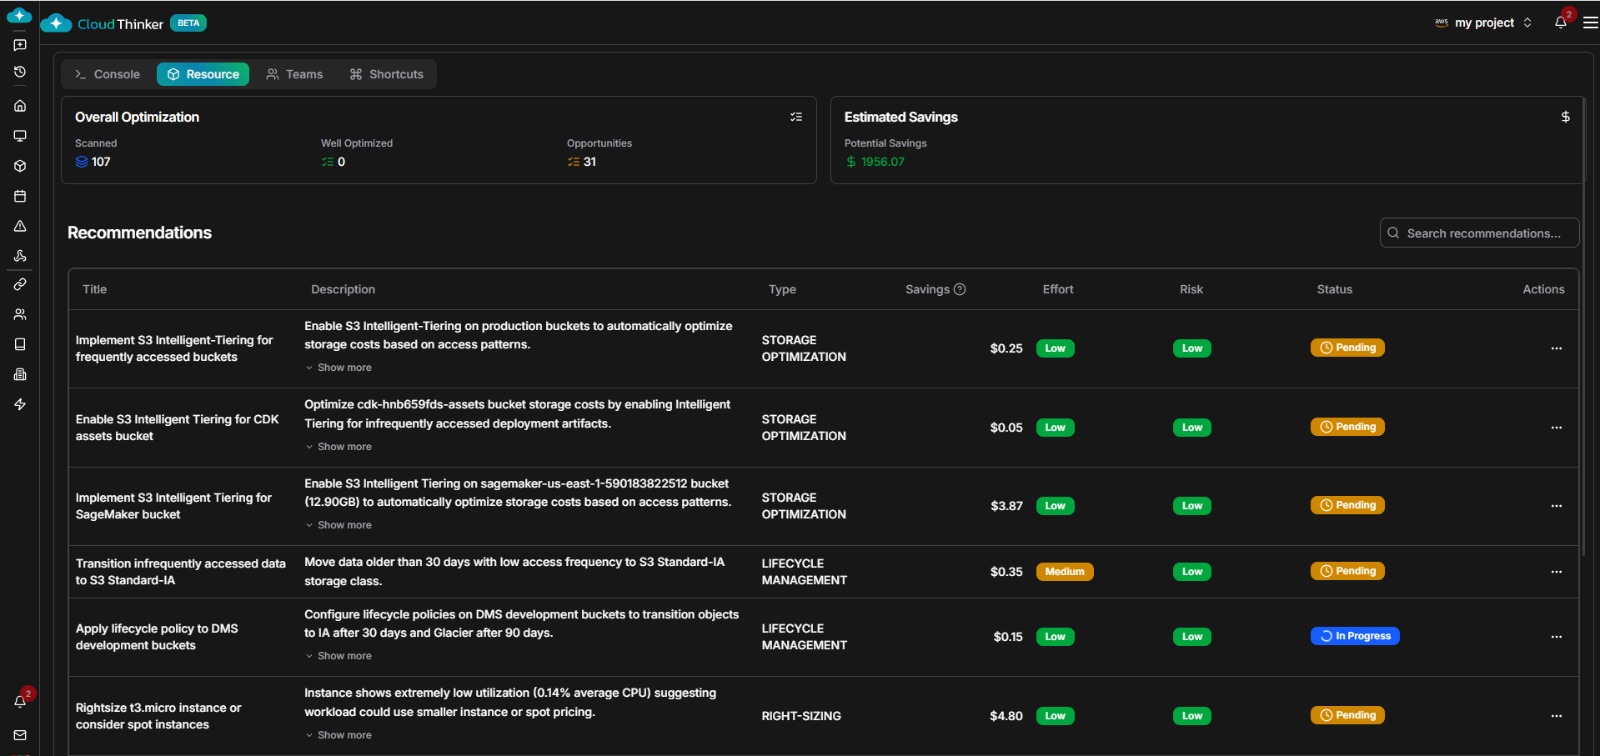
CloudThinker performs automated discovery across 21 AWS regions, delivering comprehensive visibility into your cloud estate:
Discovery Results
- 107 AWS resources inventoried and analyzed
- 31 optimization opportunities identified
- Potential savings: $1,956/month (~$23,500/year)
Specific Optimization Recommendations
Storage Optimization
- S3 Intelligent-Tiering: Reduce ~20–30% storage costs through automated storage class transitions
- 2 idle EBS volumes (508GB total): Save ~$50.8/month
- Snapshot cleanup: Remove snapshots older than 90 days no longer needed
Compute Optimization
- Rightsize EC2 m5.xlarge: Instance with 0.2% CPU utilization → downsize to save ~$120/month
- Reserved Instances: Convert On-Demand to RIs for stable workloads
- Spot Instances: Apply to non-production and batch workloads
Network Optimization
- 6 unassociated Elastic IPs: Release to save ~$21.6/month
- Cross-region transfer analysis: Optimize data transfer costs
Quantified Results
| Metric | Current | Optimized | Savings |
|---|---|---|---|
| Monthly Cost | $4,350 | $3,261 | $1,089 (25%) |
| Annual Cost | $52,200 | $39,132 | $13,068 |
| ROI Timeline | - | - | Immediate–3 months |
FinOps Dashboard
CloudThinker provides a comprehensive FinOps Dashboard with critical visualizations:
Key Metrics
-
Cost by Region (bar chart)
- Identify highest-cost regions
- Compare cost distribution across locations
-
Cost by Service (pie chart)
- EC2: 45%
- RDS: 25%
- S3: 15%
- Other services: 15%
-
Top 10 Cost Drivers (table)
- Detailed breakdown of most expensive resources
- Specific action items for each resource
-
Current vs Optimized (stacked bar comparison)
- Visualize savings potential
- Breakdown by service category
-
Monthly Projection (trendline)
- Forecast costs before/after optimization
- Track progress over time
AI-Powered FinOps Prompt
You are a FinOps & Cloud Optimization Expert.
Analyze my entire AWS environment across all regions and all services,
and propose cost optimization actions. In addition to structured
recommendations, also create a visual dashboard to summarize cost insights.
Context:
- Scope: All AWS resources, all regions, all services
- Constraints:
• No downtime for production workloads (09:00–21:00 local time)
• No data loss
• SLA: web latency p99 < 200ms, RDS CPU < 70% - Goal: minimize AWS bill globally, provide executive visibility
Instructions:
- Perform a global scan and identify:
- Idle or underutilized resources
- Orphaned resources (unattached volumes, idle ELB, unused IPs, snapshots)
- Overprovisioned resources
- Recommend pricing model optimizations:
- Savings Plans, Reserved Instances, Spot Instances
- Consolidated billing opportunities
- Optimize storage & networking:
- S3 storage class transitions
- Snapshot and backup cleanup
- Cross-region transfer analysis
- Prioritize recommendations with:
- Resource/Service + Region
- Suggested Change
- Estimated Saving ($ and %)
- Risk/Trade-off
- Implementation Steps (CLI/Console/IaC hint)
-
Provide a global roadmap (Quick Wins → Medium-term → Long-term).
-
Create a FinOps Dashboard with:
- Cost by Region (bar chart)
- Cost by Service (pie chart)
- Top 10 most expensive resources (table)
- Projected savings after optimization
- Trend chart (monthly cost projection before/after)
- Conclude with top 3 highest ROI actions and estimated new
global AWS monthly cost.
Implementation Roadmap
Quick Wins (Week 1-2)
- Release 6 unassociated Elastic IPs → $21.6/month
- Delete 2 idle EBS volumes → $50.8/month
- Enable S3 Intelligent-Tiering → $300-400/month
Medium-term (Month 1-3)
- Rightsize EC2 instances → $120/month
- Implement Reserved Instances for stable workloads → $400/month
- Cleanup old snapshots → $50/month
Long-term (Month 3-6)
- Adopt Savings Plans strategically → $200/month
- Implement Spot Instances for batch workloads → $150/month
- Optimize cross-region data transfer → $100/month
Top 3 Highest ROI Actions
1. S3 Intelligent-Tiering
- Effort: Low (1-2 hours)
- Savings: $300-400/month
- Risk: None (AWS-managed)
- ROI: Immediate
2. EC2 Rightsizing
- Effort: Medium (4-8 hours)
- Savings: $120/month
- Risk: Low (requires monitoring)
- ROI: 1 week
3. Reserved Instances
- Effort: Medium (planning required)
- Savings: $400/month
- Risk: Low (commitment-based)
- ROI: Immediate after purchase
Key Outcomes
CloudThinker helps organizations achieve:
✅ Immediate ~25% AWS cost reduction without impacting SLAs
✅ Standardized FinOps process: Discover → Recommend → Optimize → Govern
✅ Enhanced visibility for executive teams on cloud spending
✅ Automated continuous cost optimization
✅ Governance with cost allocation tracking
Business Impact
- Annual Savings: $13,068
- Time Saved: 40+ hours/month in manual analysis
- Risk Reduction: Proactive cost anomaly detection
- Strategic Planning: Data-driven capacity planning
CloudThinker transforms cloud cost management from reactive firefighting to proactive financial engineering.
