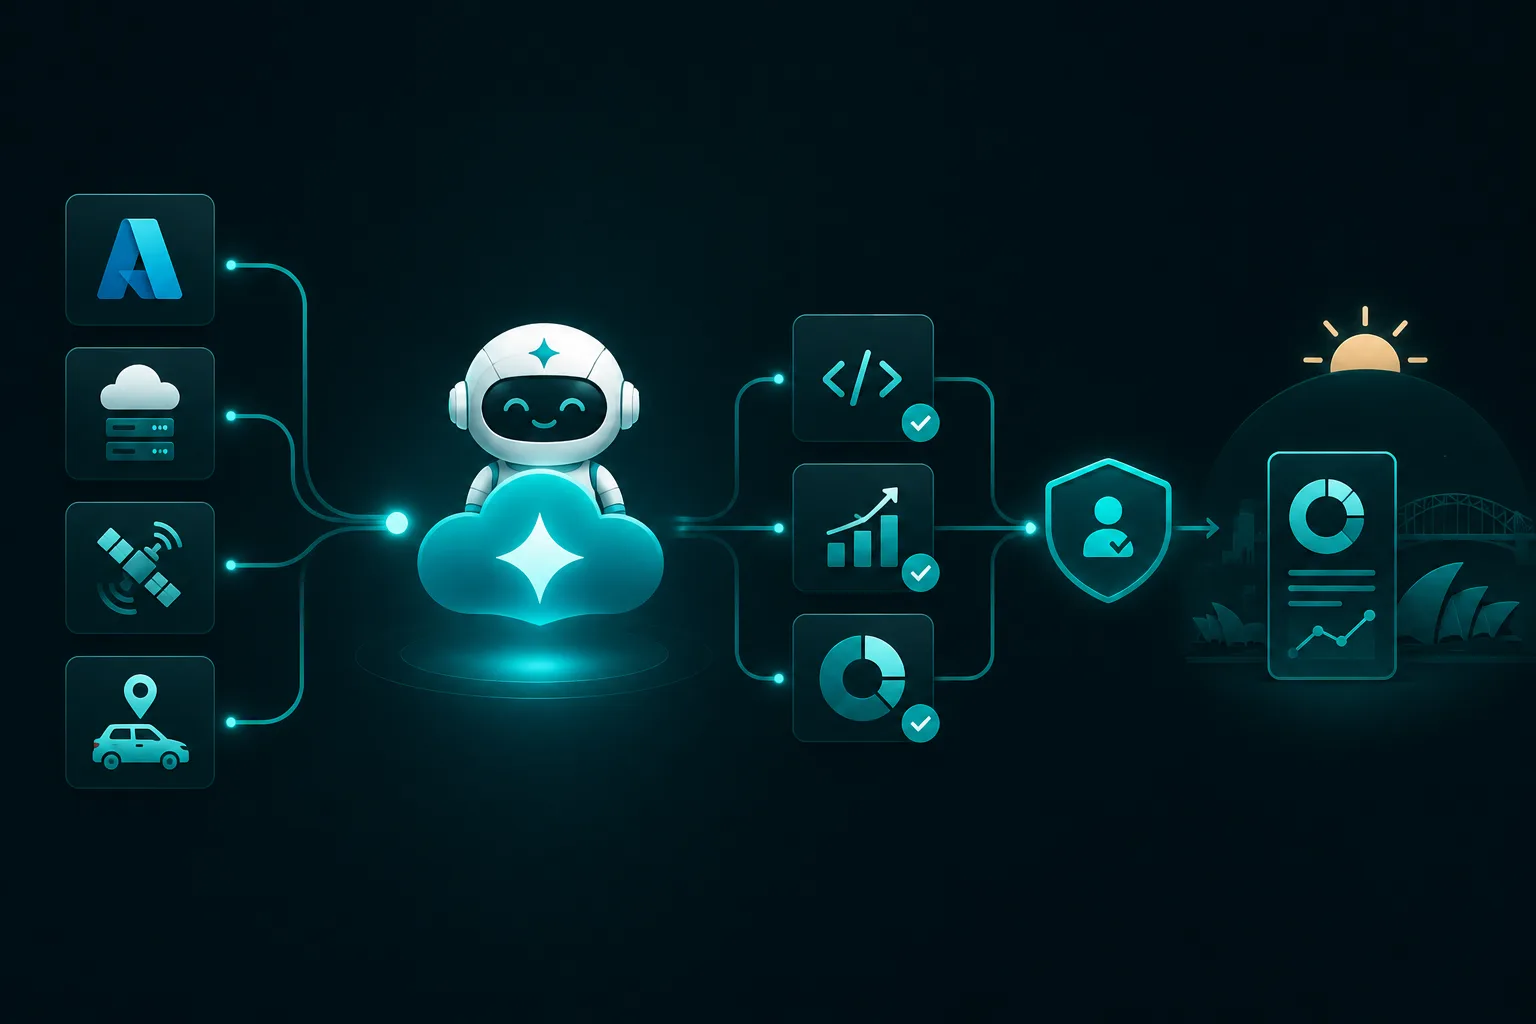
How an Australian Telematics Provider Automates Day-to-Day Operations with CloudThinker
At 7 a.m. Sydney time, before the first engineer logs on, the day's operations report is already in the channel. It covers the Azure subscriptions, the application platform on top of them, and a fleet of GPS units reporting in from vehicles across the country. On a quiet morning it's a few lines saying the estate is healthy. When something moved overnight, the anomaly arrives already traced to a layer, with a proposed next step attached.
The company behind that report is an Australian telematics provider that builds and runs GPS tracking and fleet-monitoring systems. We'll call it the operator. This post walks through the operating conditions that make telematics hard, why the usual way of covering them breaks down on a small team, and how the operator now runs code review, cost and daily assurance with CloudThinker while keeping a person on every production decision.
Why telematics is hard to operate
01Availability
Always on
Customers watch their vehicles in real time, so there is no quiet window for a slow fix.
02Security
Device input
Ingestion services parse messages from hardware in the field, which is untrusted input by definition.
03Economics
Per-device margin
Every idle VM or oversized database comes straight out of the margin on each tracked unit.
04Team
Lean by default
The same few engineers ship the product, run Azure and answer for the fleet.
Fleet customers look at the map all day, so availability is continuous. The ingestion services accept messages that originate on hardware in the field, which makes them a permanent security surface. The business is priced per tracked device, so cloud spend is margin, not overhead. And the engineers carrying all of it are few: the people who ship features also administer Azure and answer when a customer's trucks vanish from the map.
For the operator, that showed up as three recurring costs:
- Review depth depended on who was free. Pull requests on security-sensitive ingestion code got a thorough review when a senior engineer had time that week, and a quicker one when they didn't.
- Cloud cost crept up between cleanups. VMs sized for last year's traffic, storage that never moved to a cheaper tier, and resources left behind by finished projects ate into per-device margin until the next cleanup push.
- Every morning started with a manual sweep. The first hour went to the Azure portal, the platform dashboards and the fleet's connection counts, just to confirm nothing had broken overnight.
The requirement was specific: hand off the mechanical part of each job, and keep a human decision in front of anything that touches production.
Why the usual approach breaks on a small team
The standard answer to each of these is a tool plus a habit. It's the habit that fails.
Review quality is a function of calendar time. A checklist in the wiki doesn't review anything. The depth of a review tracks the reviewer's week, and the ingestion path, where a parsing bug becomes a security bug, gets the same rushed pass as a UI tweak when the sprint is tight.
Cost advice arrives without an owner. Azure Advisor will list right-sizing candidates, but each item still needs someone to check the utilization history, confirm the workload isn't seasonal, find who owns it and make the change. On a lean team that's a quarterly project, so savings show up quarterly and leak back in between.
Dashboards are per layer, incidents aren't. Azure Monitor shows the cloud. The platform has its own dashboards. flespi has its own panel for channels and streams. A drop in fleet messages could start in any of the three, and the only thing that joins them is the engineer clicking through each one in turn.
Knowledge stays in people. Which morning anomaly is normal for a public holiday, which channel misbehaves after a firmware push: that lives in the heads of whoever has been on call longest.
How CloudThinker connects
01The estate
Cloud, platform, fleet
- Code repositoriesPull requests and diffs
 Azure subscriptionsResources, metrics, health, cost
- Application platformServices, error rates, queues
 flespiDevice channels, streams, telemetry
Native APIs, nothing installed
02Operations layer
 CloudThinker
- Code reviewEvery pull request, same standard
- OptimizeProposals with utilization evidence
- Health checkThree layers before 7 a.m.
- Cross-layer triageDevice to Azure in one request
Sandboxed and guarded
03Where the team works
Chat and review
- Ops channelDaily report and anomalies
- Pull requestAnnotated before a human opens it
- ApprovalsA named person on every production change
Humans keep the decisions
CloudThinker connects to the operator's repositories, Azure subscriptions, IoT platform and team chat through CloudThinker Connections, over each system's native API, with no software installed inside the estate. Every action runs in CloudThinker's Sandbox, is checked by the Guardrails Engine, and follows the policy you set in Auto Mode.
Three capabilities carry the load, one per pressure: code review at the pull request, cost optimization as a steady stream of proposals, and the scheduled health check that opens this post.
Code review on every pull request
With Review, every pull request gets the same first pass before a human reviewer is assigned. The diff is checked against the operator's own conventions (error handling, logging, test coverage), written down by its senior engineers rather than pulled from a generic rule set. Security findings come with reasoning: injection risks, committed credentials, authorization gaps, and unsafe handling of device-originated input, which is the class of defect that matters most on a telematics ingestion path.
As an illustration, take a parser change that reads a message length from the device payload and allocates a buffer of that size. The review flags it because the length is device-controlled and unchecked, explains the failure mode (a malformed or hostile message forces a huge allocation), and points at the line where a bound belongs. The reviewer still owns the merge. What changes is the input: a pull request that's already annotated, at the same depth on a Friday evening as on a Tuesday morning.
Continuous cost optimization with Optimize
In a per-device business, cost can't be a quarterly project. Optimize evaluates the Azure estate continuously and files each finding as a separate, reviewable proposal: a resize backed by sustained utilization, an idle resource with the evidence that it's idle, a stable workload flagged as a candidate for reserved capacity. Variable workloads are left out of reservation advice on purpose.
The evidence behind an idle-VM finding is the same thing an engineer would pull by hand:
az monitor metrics list \
  --resource /subscriptions/<sub-id>/resourceGroups/<rg>/providers/Microsoft.Compute/virtualMachines/<vm> \
  --metric "Percentage CPU" "Network In Total" \
  --interval PT1H \
  --aggregation Maximum \
  --start-time 2026-09-01T00:00:00Z
If the hourly maximum CPU never leaves single digits and network traffic is only health checks for 30 days, the VM is a candidate. If it spikes every Sunday night, it's a batch box and the proposal says so instead. Each proposal lands in chat with its data, where someone approves, edits or declines it. Approved changes go through the same approval-gated path as every other action, so nobody makes the change by hand in the portal.
"Which of our Azure resources have been idle for the last 30 days? Propose what to shut down or downsize, and attach the utilization evidence for each one."
A daily health check across cloud, platform and fleet
The scheduled check runs before business hours and covers three layers:
- Azure: resource health, quota headroom, certificate and secret expiry, backup status.
- Platform: service availability, error rates, queue depths.
- Fleet: device connectivity, channel health, message throughput and backlogs.
The output is one report in the operations channel. When something is off, the engineer starts from a working hypothesis (symptom, affected layer, most likely contributing change, proposed action) rather than a wall of dashboards. The same program rolls up: a weekly summary of cost movement and review findings for the team, and a monthly estate view for management. Nobody assembles these by hand.
"Run the health check now across Azure, the platform services and the device fleet. Post the summary to the ops channel and flag anything that needs a human today."
Extending coverage to the device platform
One requirement came straight from the customer, and it's typical of the industry. The operator's devices don't talk to Azure directly. They talk to flespi, the telematics platform that manages device channels, message parsing and stream delivery. An operations layer that stopped at the cloud boundary would only ever see half of a fleet incident.
At the operator's request, CloudThinker Connections added flespi the same way as Azure: over flespi's own REST API, read-first, sandboxed and guarded.
One throughput drop, end to end
01Signal
Throughput drop
Fewer messages reach the ingestion pipeline than the usual morning curve.
02Fleet
Devices
Are units connecting at the normal rate, or did a region go dark?
03Platform
flespi
Are channels up, and are streams delivering what they receive?
04Cloud
Azure ingest
Is the consumer reading, or is a backlog building?
05Verdict
Layer at fault
One answer, with the evidence from each hop attached.
Here's the shape of a typical morning question (the details below are illustrative):
"Message throughput on the ingestion pipeline dropped this morning. Is it the devices, the flespi channels or our platform? Walk the path and tell me where it breaks."
1. Name the readings. There are four. A set of devices stopped connecting (a carrier outage in one region, a bad firmware push). A flespi channel stopped accepting or parsing messages. A flespi stream stopped delivering what the channel received. Or messages reach Azure fine and the platform's consumer is falling behind. Each reading predicts a different place where the count drops.
2. Check the fleet and channels in flespi. The channel list and its connection state come from the gateway API:
curl -s -H "Authorization: FlespiToken $FLESPI_TOKEN" \
  "https://flespi.io/gw/channels/all"
If device connections are flat against yesterday and the channels are up, the devices and the protocol layer are fine, and the first two readings drop out.
3. Check delivery into Azure. Stream status in flespi shows whether messages are leaving the platform. On the Azure side, the ingress metric shows whether they arrive. Assuming the platform consumes through an Event Hubs namespace:
az monitor metrics list \
  --resource <event-hubs-namespace-resource-id> \
  --metric IncomingMessages OutgoingMessages \
  --interval PT5M \
  --aggregation Total
Incoming steady and outgoing falling means the messages arrive and the consumer isn't keeping up. Incoming falling with healthy flespi channels points back at the stream.
4. Report the layer, with the evidence. The answer in the channel names the layer at fault, shows the number from each hop, and proposes the next step: restart the stuck consumer, scale it, or open a ticket with the stream configuration attached. In production, that step waits for a named approver.
For a business whose product is the connected fleet, that reach from device to cloud is what separates a monitoring tool from an operations layer.
Why this beats the traditional approach
| Traditional approach | With CloudThinker | |
|---|---|---|
| Code review | Depth depends on who has time that week | Same first pass on every pull request, with reasoning |
| Device-input security | Caught when a senior reviewer happens to look | Flagged on every change to the ingestion path |
| Cost | Quarterly cleanup, leaks back in between | Continuous proposals with utilization evidence |
| Morning assurance | An hour across the portal, dashboards and fleet panel | A pre-correlated report before 7 a.m. |
| Fleet incidents | Three consoles, joined by one engineer | One request walks device to Azure |
| Knowledge | In the heads of the longest-serving on-call | Stored with each finding and reused |
The deeper difference is where the joins happen. Each tool the operator already had was good at its own layer. The hard part was always connecting a parser change to a security risk, a utilization curve to an owner, a fleet drop to the hop where it started. That joining work used to be a person's morning. Now it arrives done, and the person makes the call.
Gated by design
CloudThinker acts within Auto Mode, so the operator decides what runs on its own and what waits for approval. CloudThinker reads freely (metrics, logs, inventory, pull requests, flespi status) and proposes. For the operator, a human approval is still in front of every production-affecting action, from a VM resize to a consumer restart.
Results
The operator measures the outcome in where engineering time goes:
- Review effort moved up the stack. The mechanical quality and security pass is done before a human opens the pull request. Senior engineers spend their review time on architecture and product decisions.
- Security review became uniform. Every change to the device-facing surface gets the same analysis, whatever the team's workload.
- Cost governance became continuous. Small right-sizing decisions get approved in chat as they come up, instead of waiting for a cleanup project, which protects per-device margin.
- The morning sweep became a short read. The hour of manual checks turned into a few minutes with a pre-correlated report.
"CloudThinker will change the way we run operations in the future."
CEO, the operator
Getting started
The operator's setup takes three steps.
1. Connect the stack. Repositories, Azure subscriptions and team chat through CloudThinker Connections. Add flespi or your own IoT platform when you want fleet coverage.
2. Turn on code review and get a cost baseline.
"Review every new pull request against our engineering standards and security policy before a human reviewer is assigned. And give me a cost baseline for our Azure subscriptions: where the spend is, and what looks idle or oversized."
3. Schedule the health check.
"Every weekday at 7 a.m. Sydney time, run a health check across Azure, the platform services and the device fleet. Post the summary to the ops channel. Propose only: change nothing and flag what needs a human."
Full reference documentation is at docs.cloudthinker.io.
Related reading
- Review: quality and security on every pull request
- Optimize: continuous cloud cost optimization
- CloudThinker Platform: architecture and primitives
- Auto Mode: graduated autonomy with safe defaults
- CloudThinker × Azure DevOps: autonomous code review
Conclusion
Continuous availability, a device-facing attack surface, per-device economics and a lean team are the standing conditions of telematics, not one company's bad luck. The operator handed CloudThinker the mechanical half of each job and kept the decisions: every pull request reviewed to the same standard, cost managed as a stream of approved proposals, and the whole estate, from cloud to platform to fleet, checked before the team starts the day.
To try the same setup on your own estate, see the CloudThinker Platform, read the documentation, or book a discovery call.
Steve Tran, CTO, CloudThinker